Home
2024
Election Results
Election Info
Weblog
Forum
Wiki
Search
Email
Login
Site Info
Store
2018 Senatorial General Election - Tennessee
Note: The Google advertisement links below may advocate political positions that this site does not endorse.
Choose Office
Governor
Official Results
Choose State
Arizona Class 1
California Class 1
Connecticut Class 1
Delaware Class 1
Florida Class 1
Hawaii Class 1
Indiana Class 1
Maine Class 1
Maryland Class 1
Massachusetts Class 1
Michigan Class 1
Minnesota Class 1
Minnesota Class 2
Mississippi Class 1
Mississippi Class 2
Missouri Class 1
Montana Class 1
Nebraska Class 1
Nevada Class 1
New Jersey Class 1
New Mexico Class 1
New York Class 1
North Dakota Class 1
Ohio Class 1
Pennsylvania Class 1
Rhode Island Class 1
Texas Class 1
Utah Class 1
Vermont Class 1
Virginia Class 1
Washington Class 1
West Virginia Class 1
Wisconsin Class 1
Wyoming Class 1
Senatorial
Candidate
Political
Party
Popular Vote
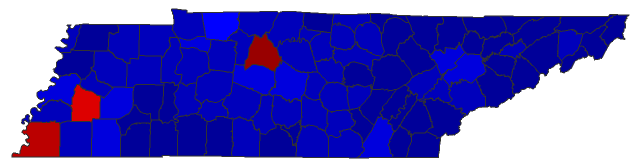
Marsha Blackburn
Republican
1,227,483
54.71%
Phil Bredesen
Democratic
985,450
43.92%
Trudy A. Austin
Independent
9,455
0.42%
Dean Hill
Independent
8,717
0.39%
Other (
+
)
-
12,635
0.56%
Total Vote
2,243,740
Maps
(Note: click the 'H' buttons above to hold the given map and change the image map)
Per
Democratic
Republican
Pie
>20%
>30%
>40%
>50%
>60%
>70%
>80%
>90%
Election Data and Statistics:
County Data (Table)
(m)
County Data (Graphs)
Purchase Detailed Data
Compare State Data by Year (Table)
Compare State Data by Year (Graphs)
View All 2018 Tennessee Data
Compare State Maps by Year
View All 2018 Tennessee Maps
Data Sources:
Source for Popular Vote data: Tennessee Secretary of State. Division of Elections, "United States Senate,"
State of Tennessee November 6, 2018 State General
(Nashville, 2018)
< 2014
Choose Year
2020
2014
2012
2020 >
Classic Tennessee Results for 2018
-
National Results for 2018
Login
Terms of Use
-
DCMA Policy
-
Privacy Policy and Cookies
©
Dave Leip's Atlas of U.S. Elections, LLC 2019 All Rights Reserved