Note: The Google advertisement links below may advocate political positions that this site does not endorse.
Official Results
  Gubernatorial
Candidate
Lt. Gubernatorial
Candidate
Political
Party
Popular Vote
Tim WalzPeggy FlanaganDemocratic-F.L. 1,393,096 53.84%
Jeff JohnsonDonna BergstromRepublican 1,097,705 42.43%
Chris WrightJudith SchwartzbackerGrassroots 68,667 2.65%
Josh WelterMary O'ConnorLibertarian 26,735 1.03%
YOther (+) - - 1,084 0.04%
Total Vote 2,587,287
Maps
2018 Gubernatorial General Election - Minnesota Election County Map
County H
County Pop H
2014 Button H
Per Vote Democratic-F.L. Button H
Per Vote Republican Button H
Swing Map Button H
Trend Map Button H
Town H
Last Button H
Per Vote Democratic-F.L. Button H
Per Vote Republican Button H
Swing Map Button H
Trend Map Button H
 
(Note: click the 'H' buttons above to hold the given map and change the image map)
PerDemocraticRepublicanPie
>20%
 
0
 
 
0
 
pie
>30%
 
0
 
 
0
 
>40%
 
107
 
 
107
 
>50%
 
369
 
 
369
 
>60%
 
86
 
 
86
 
>70%
 
22
 
 
22
 
>80%
 
7
 
 
7
 
>90%
 
2
 
 
2
 
 Election Data and Statistics:
Data Sources:
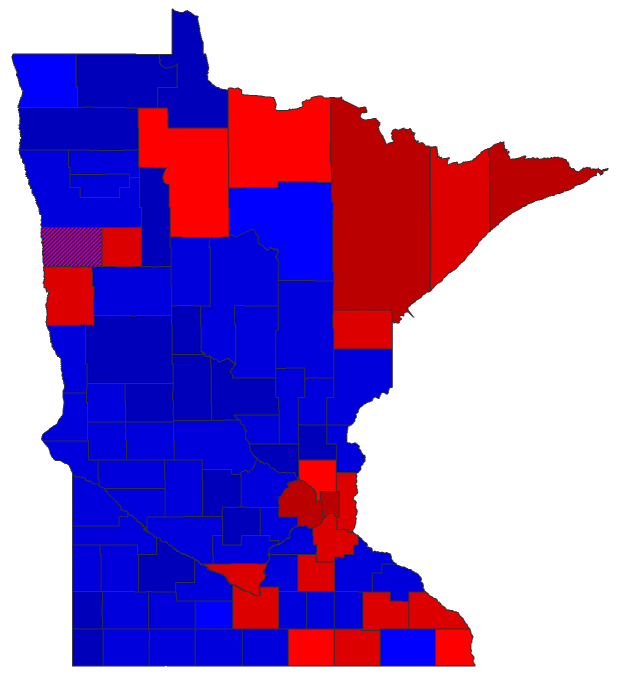
  • Source for Popular Vote data: Minnesota Office of the Secretary of State. Elections Division. Report of the Votes Cast Minnesota State General Election Tuesday, November 6, 2018, Minnesota Office of the Secretary of State. Elections Division (https://electionresults.sos.state.mn.us/Results/MediaResult/115?mediafileid=27) (accessed 07 Dec 2018)


Classic Minnesota Results for 2018 - National Results for 2018

Login

Terms of Use - DCMA Policy - Privacy Policy and Cookies


© Dave Leip's Atlas of U.S. Elections, LLC 2019 All Rights Reserved