Home
2024
Election Results
Election Info
Weblog
Forum
Wiki
Search
Email
Login
Site Info
Store
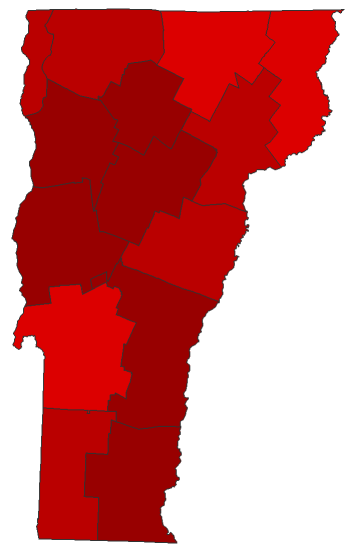
2018 Representative General Election - Vermont
Note: The Google advertisement links below may advocate political positions that this site does not endorse.
Choose Office
Senator Class 1
Governor
Official Results
Choose State
Alaska
Delaware
Montana
North Dakota
South Dakota
Vermont
Wyoming
Representative
Candidate
Political
Party
Popular Vote
Peter Welch
Democratic
188,547
69.20%
Anya Tynio
Republican
70,705
25.95%
Cris Ericson
Independent
9,110
3.34%
Laura S. Potter
Liberty Union
3,924
1.44%
Write-ins
-
165
0.06%
Total Vote
272,451
Maps
(Note: click the 'H' buttons above to hold the given map and change the image map)
Per
Democratic
Republican
Pie
>20%
0
0
>30%
0
0
>40%
6
6
>50%
71
71
>60%
85
85
>70%
58
58
>80%
14
14
>90%
1
1
Election Data and Statistics:
County Data (Table)
(m)
County Data (Graphs)
City and Town Data
(m)
Purchase Detailed Data
Compare State Data by Year (Table)
Compare State Data by Year (Graphs)
View All 2018 Vermont Data
Compare State Maps by Year
View All 2018 Vermont Maps
Data Sources:
Source for Popular Vote data:
< 2016
Choose Year
2022
2020
2016
2014
2012
2020 >
Classic Vermont Results for 2018
-
National Results for 2018
Login
Terms of Use
-
DCMA Policy
-
Privacy Policy and Cookies
©
Dave Leip's Atlas of U.S. Elections, LLC 2019 All Rights Reserved