Home
2024
Election Results
Election Info
Weblog
Forum
Wiki
Search
Email
Login
Site Info
Store
1998 Gubernatorial Republican Primary Election Results - Nevada
Note: The Google advertisement links below may advocate political positions that this site does not endorse.
Data for this Contest was Contributed by on 2007-04-10
Gubernatorial
Candidate
Political
Party
Popular Vote
Kenny Guinn
Republican
76,953
58.14%
Aaron Russo
Republican
34,251
25.88%
Lonnie Hammargren
Republican
13,410
10.13%
None of these Candidates
Republican
5,783
4.37%
Bruce Westcott
Republican
1,956
1.48%
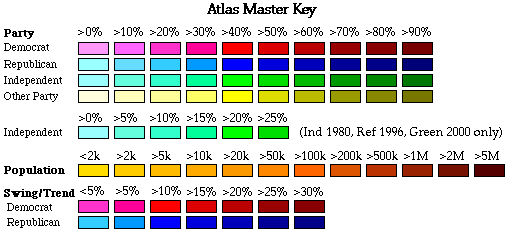
Map Key
> 40%
> 50%
> 60%
> 70%
Turnout
Maps
Pop. (m)
Demographic Data
2000 Population:
1,998,257
Enum.
2000 Population Density:
7.0
persons/km
2
1998 Population:
1,853,191
Est.
1998 Population Density:
6.5
persons/km
2
1990 Population:
1,201,675
Enum.
1990 Population Density:
4.2
persons/km
2
Land Area (2000):
284,448
km
2
Annual Pop Growth Rate:
5.2
%
Election Data and Statistics:
County Data (Table)
(m)
County Data (Graphs)
Purchase Detailed Data
Compare State Maps by Year
View All 1998 Nevada Maps
Election Tools
Atlas Forum
Image Code for Maps:
County
,
Pop
Data Sources:
Source for Popular Vote data: Nevada Secretary of State.
1998 Official Primary Election Returns
, Nevada Secretary of State (http://sos.state.nv.us/nvelection/1998Primary/98offprimret.pdf) (accessed 10 Apr 2007)
Source for Population data: U.S. Census Bureau.
Results for and Individual County:
(m)
Choose Year
2022
2018
2010
2006
1978
1974
1970
1966
1962
1930
1922
1918
Choose Office
Choose State
Alabama
California
Colorado
Georgia
Hawaii
Idaho
Illinois
Kansas
Maine
Michigan
Nebraska
New Hampshire
Oregon
Tennessee
Vermont
Wyoming
Nevada Election Results Home
-
National Results for 1998
-
Use Frame Navigation
Login
Terms of Use
-
DCMA Policy
-
Privacy Policy and Cookies
©
Dave Leip's Atlas of U.S. Elections, LLC 2019 All Rights Reserved


