Home
2024
Election Results
Election Info
Weblog
Forum
Wiki
Search
Email
Login
Site Info
Store
1998 Attorney General General Election Results - Texas
Note: The Google advertisement links below may advocate political positions that this site does not endorse.
Data for this Contest was Contributed by on 2007-04-02
Attorney General
Candidate
Political
Party
Popular Vote
John Cornyn
Republican
2,002,794
54.26%
Jim Mattox
Democratic
1,631,045
44.18%
Mike Angwin
Libertarian
57,604
1.56%
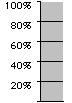
Map Key
> 40%
> 50%
> 60%
> 70%
> 80%
Turnout
Maps
Pop. (m)
Demographic Data
2000 Population:
20,851,820
Enum.
2000 Population Density:
30.8
persons/km
2
1998 Population:
20,157,531
Est.
1998 Population Density:
29.7
persons/km
2
1990 Population:
16,986,335
Enum.
1990 Population Density:
25.1
persons/km
2
Land Area (2000):
678,051
km
2
Annual Pop Growth Rate:
2.1
%
Election Data and Statistics:
County Data (Table)
(m)
County Data (Graphs)
Purchase Detailed Data
Compare State Data by Year (Table)
Compare State Data by Year (Graphs)
View All 1998 Texas Data
Compare State Maps by Year
View All 1998 Texas Maps
Election Tools
Atlas Forum
Image Code for Maps:
County
,
Pop
Data Sources:
Source for Popular Vote data: Texas Secretary of State.
1998 General Election
, Texas Secretary of State (http://elections.sos.state.tx.us/elchist.exe) (accessed 02 Apr 2007)
Source for Population data: U.S. Census Bureau.
Results for and Individual County:
(m)
Choose Year
2022
2018
2014
2010
2006
2002
1994
1990
1964
Choose Office
Governor
Lt. Governor
Comptroller General
Agriculture Commissioner
Choose State
Alabama
Arizona
Arkansas
California
Colorado
Connecticut
Florida
Georgia
Idaho
Illinois
Iowa
Kansas
Maryland
Massachusetts
Michigan
Minnesota
Nebraska
Nevada
New Mexico
New York
Ohio
Rhode Island
South Carolina
Vermont
Wisconsin
2022 >
Texas Election Results Home
-
National Results for 1998
-
Use Frame Navigation
Login
Terms of Use
-
DCMA Policy
-
Privacy Policy and Cookies
©
Dave Leip's Atlas of U.S. Elections, LLC 2019 All Rights Reserved


