Home
2024
Election Results
Election Info
Weblog
Forum
Wiki
Search
Email
Login
Site Info
Store
1948 Senatorial General Election Results - Illinois
Note: The Google advertisement links below may advocate political positions that this site does not endorse.
Data for this Contest was Contributed by on 2016-01-19
Senatorial
Candidate
Political
Party
Popular Vote
Paul H. Douglas
Democratic
2,147,754
55.07%
C. Wayland Brooks
Republican
1,740,026
44.61%
Enoch A. Holtwick
Prohibition
9,784
0.25%
Other (
+
)
-
2,721
0.07%
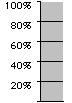
Map Key
> 40%
> 50%
> 60%
> 70%
Turnout
Maps
Demographic Data
1950 Population:
8,712,176
Enum.
1950 Population Density:
60.5
persons/km
2
1940 Population:
7,897,241
Enum.
1940 Population Density:
54.9
persons/km
2
Land Area (2000):
143,961
km
2
Annual Pop Growth Rate:
1.0
%
Election Data and Statistics:
County Data (Table)
(m)
County Data (Graphs)
(m)
Compare State Data by Year (Table)
Compare State Data by Year (Graphs)
View All 1948 Illinois Data
Compare State Maps by Year
View All 1948 Illinois Maps
Election Tools
Atlas Forum
Image Code for Maps:
County
Data Sources:
Source for Popular Vote data: Allied Printing, comp, "Vote for U.S. Senator,"
Official Vote of the State of Illinois Cast at the General Election of November 2, 1948
(Springfield: Allied Printing, 1949)
Source for Population data: U.S. Census Bureau.
Results for and Individual County:
(m)
Choose Year
2022
2020
2016
2014
2010
2008
2004
2002
1998
1996
1992
1990
1986
1984
1980
1978
1974
1972
1970
1968
1966
1962
1960
1956
1954
1950
1944
1942
1940
1938
1936
1932
1930
1926
1924
1920
1918
1914
Choose Office
President
Governor
Secretary of State
Choose State
Colorado
Delaware
Iowa
Massachusetts
Michigan
Minnesota
Montana
New Hampshire
New Mexico
Oklahoma
Oregon
1990 >
Illinois Election Results Home
-
National Results for 1948
-
Use Frame Navigation
Login
Terms of Use
-
DCMA Policy
-
Privacy Policy and Cookies
©
Dave Leip's Atlas of U.S. Elections, LLC 2019 All Rights Reserved


