PredictionsEndorse2018 Senatorial Election Polls - PA ResultsPolls
Note: The Google advertisement links below may advocate political positions that this site does not endorse.
Pennsylvania Polls (Aggregate = Strong Casey for 3-poll average)National Summary
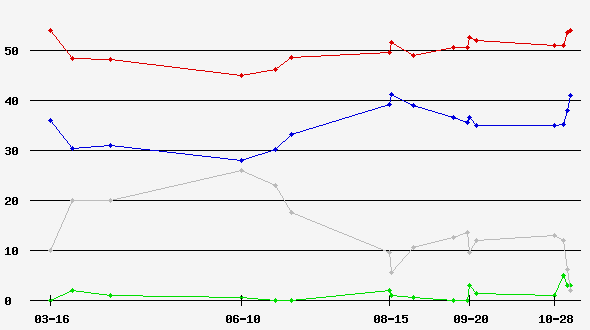
Candidate Party Avg. #Wins Poll Graph
Robert P. Casey, Jr.* Democratic 54% 3pie
Louis J. Barletta Republican 41% 0
Other - 3% 0
-Undecided- 2% 0

 Three-Poll Rolling Average
 Rolling Average Poll Graph

DatePoll Source Spread Rep Dem IndUnd M.O.E. Sample#C
2018-11-04Change ResearchD +744%51%3%2%3%1,833 L
2018-11-03Research ConsultantsD +1741%58%1%0%4%436 L13
2018-11-01Muhlenberg CollegeD +1538%53%5%4%6%421 L13
2018-10-28Franklin and Marshall CollegeD +1535%50%0%15%10%214 L20
2018-09-23Franklin and Marshall CollegeD +1733%50%0%17%6%545 R5
2018-09-20IpsosD +1637%53%3%7%3%1,080 L0
2018-09-19Muhlenberg CollegeD +1835%53%0%12%6%404 L25
2018-09-13RasmussenD +1438%52%0%10%4%800 L6
2018-08-26Franklin and Marshall CollegeD +1334%47%0%19%6%511 R8
2018-08-16Marist CollegeD +1538%53%0%9%4%713 R38
2018-08-15Other SourceD +245%47%2%4%4%500 L
2018-07-02SurveyMonkey/AxiosD +1441%55%0%4%3%990 L
2018-06-25Suffolk UniversityD +1532%47%0%21%4%500 L15
2018-06-10Franklin and Marshall CollegeD +1727%44%0%28%7%472 R22
2018-04-12Muhlenberg CollegeD +1632%48%0%20%6%414 L
2018-03-26Franklin and Marshall CollegeD +1825%43%2%30%7%423 R33
2018-03-16Public Policy PollingD +1836%54%0%10%3%1,056 R18


Back to 2018 Senatorial Polls Home - Polls Home


Terms of Use - DCMA Policy - Privacy Policy and Cookies

© Dave Leip's Atlas of U.S. Elections, LLC 2019 All Rights Reserved