PredictionsMock2016 Presidential Republican Primary Polls - NJ ResultsPolls
Note: The Google advertisement links below may advocate political positions that this site does not endorse.

New Jersey Polls (Aggregate = Strong Trump for 3-poll average)

Candidate Avg. #Wins Delegates Poll Graph Election Details
Trump 38% 3 51pie
Election Date: 2016-06-07
Election Type: Primary
Eligable Voters: Modified Open
Delegates Total: 51
Delegates Awarded: 51
Apportion Method: WTAD/S
Cruz 11% 0 0
Rubio 10% 0 0
Kasich 9% 0 0
Christie 8% 0 0
Carson 5% 0 0
Other 10% 0 0
-Undecided 9% 0 0

 Three-Poll Rolling Average
 Rolling Average Poll Graph

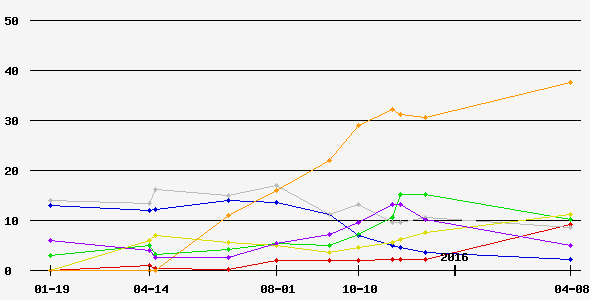
 Delegates Awarded Prior to this Contest: 1,903 (77.0%)

 Projected Delegate Allocation Prior to this Contest:
Prior Delegate Allocation Graph

DatePoll SourceLeadKB R C T C W OthUnd MOE Sample#C
04-08Eagleton-RutgersT+2824%0%0%18%52%0%0%4%2%7%244 L9
12-06Eagleton-RutgersT+162%2%13%10%30%4%0%20%19%6%230 L4
11-15Fairleigh Dickinson UniversityT+132%5%18%6%31%11%0%22%5%6%307 L1
11-08Quinnipiac UniversityT+153%4%15%7%31%16%0%16%8%5%481 R
10-10Eagleton-RutgersT+192%5%13%6%32%13%0%13%16%6%266 L3
09-15IpsosT+142%6%4%4%34%11%1%33%5%7%109 L
08-01Eagleton-RutgersT+92%10%5%4%21%5%10%24%19%7%263 L
06-21Fairleigh Dickinson UniversityTie0%18%6%3%11%6%9%37%10%4%792 L6
04-19Fairleigh Dickinson UniversityC+60%13%0%8%0%0%14%43%22%6%268 L
04-14Quinnipiac UniversityC+81%11%7%6%0%2%14%46%13%5%444 L
01-19Quinnipiac UniversityC+110%13%3%0%0%6%4%60%14%6%315 L


Back to 2016 Presidential Polls Home - Polls Home


Terms of Use - DCMA Policy - Privacy Policy and Cookies

© Dave Leip's Atlas of U.S. Elections, LLC 2019 All Rights Reserved